How to Measure Marketing ROI for Your Business
Pouring money into marketing without knowing what you get back is like flying blind. You need a simple, repeatable system to track what actually works and what doesn't.
This process is what turns marketing from an unpredictable expense into a reliable growth engine. It’s how you start making confident, data-backed decisions instead of just guessing.
Why Measuring Marketing ROI Is a Survival Skill
In today's world, justifying your marketing spend isn't just good practice—it's essential for survival. Gone are the days of launching campaigns based on gut feelings alone. Now, every dollar has to be accountable, directly connecting your activities to the bottom line.
Without a clear view of your return on investment, you're just wasting resources on channels that don’t deliver while completely missing your most profitable opportunities.
The pressure to prove your worth is only getting stronger. A striking statistic shows that 83% of marketing leaders now rank demonstrating ROI as their absolute top priority. This is a huge jump from just five years ago.
This shift is all about efficiency. The data is clear: businesses that mandate ROI tracking for every single campaign manage to secure 1.6x more budget. You can find more details on these marketing ROI statistics and see how they directly impact budget allocation.
The Core Process of ROI Measurement
Mastering how to measure marketing ROI doesn't require a Ph.D. in data science. It’s really about setting up a straightforward, four-step workflow that gives you clarity and direction.
This infographic breaks down that simple process.

Each stage builds on the last, creating a reliable loop that takes you from high-level strategy and data collection all the way to actionable insights you can actually use.
Before we get into the weeds, here's a high-level look at the framework we're going to build. This table breaks down the core components of an effective ROI measurement system.
Quick Start ROI Measurement Framework
| Component | Key Action | Primary Goal |
|---|---|---|
| Foundation | Define clear business goals and unit economics (LTV, CAC). | Establish what "success" actually looks like in financial terms. |
| Tracking | Implement UTMs, GA4 events, and a conversion API. | Reliably capture where leads and sales are coming from. |
| Analysis | Choose a simple attribution model and calculate core metrics. | Connect marketing activities directly to revenue. |
| Reporting | Build a live spreadsheet or dashboard to visualize results. | Make data accessible and easy to understand for quick decisions. |
Think of this as your roadmap. Each piece is designed to give you a clear, repeatable process for turning marketing spend into predictable growth.
The real magic isn't in a one-off calculation; it's in building a repeatable system. This turns marketing from an expense into a predictable driver of growth, allowing you to confidently double down on what works and cut what doesn't.
By adopting this mindset, you stop hoping for the best and start engineering predictable outcomes. The rest of this guide will walk you through setting up each part of this system, starting with the financial metrics that truly define success.
Defining Your Financial North Star
Before you can measure marketing ROI with any confidence, you need a destination. Without knowing what a “good” return actually looks like for your business, you’re just tracking numbers in a vacuum. This financial destination—your North Star—is built on two metrics that matter more than almost anything else: Customer Lifetime Value (LTV) and Customer Acquisition Cost (CAC).

Trying to measure ROI without LTV and CAC is like captaining a ship without a compass or a map. You might be moving, but you have no clue if you’re heading toward treasure or a storm.
Simplifying Customer Lifetime Value
Customer Lifetime Value (LTV) is the total revenue you can reasonably expect from a single customer over their entire relationship with you. It’s not just their first purchase; it’s every dollar they spend until they churn. Getting this number right is a game-changer.
Let's keep it simple.
For a SaaS tool with a $50/month subscription, if your average customer sticks around for 18 months, the LTV is straightforward:
- $50/month x 18 months = $900 LTV
For an e-commerce brand, like a coffee subscription box, it’s a little different but just as easy. If the average order is $40 and a customer typically makes 6 purchases before they cancel, the math is:
- $40/order x 6 orders = $240 LTV
The key here is to avoid getting bogged down in complex formulas at the start. You just need a practical, "good enough" number to guide your decisions. You can always refine it later. For a deeper dive, we have a detailed guide on how to go about https://www.unkoa.com/improving-customer-lifetime-value/.
Understanding Customer Acquisition Cost
Customer Acquisition Cost (CAC) is the total amount you spend on sales and marketing to land one new customer. This isn’t just your ad spend—it includes everything from content creation and sales commissions to the software subscriptions for your marketing tools.
To calculate it, you just divide your total marketing and sales expenses over a set period by the number of new customers you won in that same timeframe.
For example, if you spent $5,000 on a Google Ads campaign last month and it brought in 50 new customers, your CAC for that specific campaign would be:
- $5,000 / 50 customers = $100 CAC
To keep these numbers clean, you absolutely need organized expense tracking from day one. Using accounting software like Xero helps you categorize marketing expenses properly, making your CAC calculation much more reliable and a lot less painful.
Your marketing is profitable as long as your LTV is greater than your CAC. A healthy business typically aims for an LTV to CAC ratio of at least 3:1. That means for every dollar you spend to get a customer, you get three dollars back over their lifetime.
Connecting Metrics to Measurable Goals
Once you have your LTV and CAC, you can finally move past vague goals like "grow the business" and set concrete targets that actually mean something for your bottom line. These goals are what make your ROI analysis useful.
Here are a few examples of strong, measurable goals:
- Achieve a 3:1 LTV to CAC ratio by the end of Q4.
- Reduce our blended CAC from $150 to $120 within six months.
- Increase the LTV of new customers by 15% next year by improving retention.
Goals like these transform ROI from a backward-looking report card into a forward-looking strategy. Now, every marketing decision—which channel to invest in, which campaign to launch—can be weighed against these targets.
To really nail this, it’s critical to understand which metrics truly matter. You can get a much deeper look into selecting and measuring ROI with AI BI and key metrics. This will help you focus on the numbers that have the biggest impact on your business.
Building Your Data Collection Toolkit
If you can't trust your data, you can't measure your ROI. It's that simple. Any calculation you make will just be guesswork unless you have a reliable way to see how customers find you and what they do on your site.
Setting up a solid data toolkit doesn't have to be some complex technical nightmare. For a solo operator, you really only need a few core pieces to get the job done.

The goal here is to build a simple, effective system that tells you exactly where your leads and sales are coming from. We'll break it down into three key areas: UTM parameters, Google Analytics 4 events, and server-side tracking.
Mastering UTMs for Clear Tracking
Urchin Tracking Modules (UTMs) are just small snippets of text you tack onto the end of a URL. They don’t change the page someone lands on, but they tell your analytics exactly how that person got there. Think of them as digital breadcrumbs leading right back to your marketing campaigns.
Every single link you share—in an email, a social post, an ad—should have UTMs. This practice alone will kill the dreaded "(direct) / (none)" traffic source in your analytics and give credit where it's due.
A UTM-tagged link has a few key parts:
- utm_source: This is the platform that sent the traffic, like
google,facebook, ornewsletter. - utm_medium: This is the marketing channel, such as
cpc(for paid ads),social, oremail. - utm_campaign: This names your specific campaign, like
summer_sale_2024orq4_promo.
For example, a link for a summer sale ad you’re running on Facebook might look like this:yourwebsite.com/sale?utm_source=facebook&utm_medium=cpc&utm_campaign=summer_sale_2024
This level of detail is non-negotiable for measuring ROI because it lets you see which specific campaigns on which platforms are actually driving results.
Setting Up Essential Conversions in Google Analytics 4
Google Analytics 4 (GA4) is the central hub for your website data. While it tracks a lot of things right out of the box, its real power comes from setting up custom conversion events. These are the specific, valuable actions you want people to take, like making a purchase or filling out a contact form.
Without these, you can’t connect traffic sources to actual business outcomes. For a small operation, you don't need dozens of them. Just focus on the one or two actions that directly lead to revenue.
Common conversion events include:
- purchase: The absolute must-have for any e-commerce store.
- generate_lead: Triggered when a user submits a form on your site.
- schedule_meeting: For consultants or service businesses, this is a high-intent action.
To make setting this up easier, I strongly recommend using Google Tag Manager. It lets you deploy tracking scripts without having to touch your site's code. This comprehensive guide on using Google Tag Manager is a great place to start. And if you need more help with the fundamentals, we have a whole guide on Google Analytics for small businesses.
A classic mistake is tracking "vanity" metrics like page views or session duration as goals. Focus only on events that have a direct financial impact. It keeps your ROI analysis clean and actionable.
The Rise of Server-Side Tracking
Let's be honest: in a world of ad-blockers and privacy updates, browser-based tracking (like the standard GA4 tag) is getting less reliable by the day. This is where server-side tracking comes in.
Instead of your visitor's browser sending data directly to Google or Facebook, your website's server sends it.
This method is way more accurate and durable. It bypasses most ad-blockers and isn't crippled by browser cookie rules, meaning more of your conversion data actually gets captured. Facebook's Conversion API (CAPI) is a perfect example of this shift.
The market for this kind of tech is exploding. The global Advertising Effectiveness & ROI Measurement market is projected to jump from $4.6 billion to $16.4 billion by 2034, driven by these smarter tools. And it’s not just hype—advertisers in the U.S. using AI-powered analytics are already seeing a 76% increase in ROI.
If user privacy is your absolute top priority, tools like Fathom offer cookieless analytics that give you the data you need without compromising visitor privacy.
Alright, you've got clean data flowing in. Now, what do you do with it? This is where attribution modeling enters the picture, and it’s a topic that sends most people running for the hills.
Attribution is just a fancy word for assigning credit. When a customer buys something, which marketing touchpoint gets the trophy? The first ad they ever saw? The last email they clicked? The blog post they read in between?
It’s tempting to fall down a rabbit hole here, trying to build a perfect, multi-touch system that gives fractional credit to every single tweet and webinar. For a solo operator or a small team, that path leads to analysis paralysis, not clarity.
The goal isn't perfection; it's a consistent yardstick. A simple, understandable model you actually use is infinitely more valuable than some technically flawless model that’s too complicated to mean anything.
The Simple Models Worth Your Time
For most businesses just getting their feet wet with ROI, there are really only two models to even think about at the start: First Touch and Last Touch. They’re dead simple to understand, easy to set up in Google Analytics, and give you a clear, actionable starting point.
Let's use a quick soccer analogy. The customer's journey is the game.
- First-Touch Attribution: This model gives 100% of the credit to the very first marketing channel that brought someone to your site. Think of it like crediting the player who made the first long pass down the field. This is brilliant for figuring out which channels are best at generating brand new awareness and filling the top of your funnel.
- Last-Touch Attribution: This one gives 100% of the credit to the final touchpoint before the conversion. It's like giving all the glory to the player who kicked the ball into the net, ignoring all the assists. It’s the easiest model to track and fantastic for identifying which channels are actually closing deals.
Sure, there are others. You might hear about the Linear model, which splits credit equally among all touchpoints. While it acknowledges the whole journey, it often dilutes the impact of the most important moments and adds a layer of complexity you probably don't need right now.
So, Which One Should You Pick?
It really boils down to your main marketing goal at this moment.
If your primary mission is to drive new leads and get your name out there, First-Touch attribution is your guide. It will clearly show you which top-of-funnel channels are pulling their weight. If your focus is squarely on optimizing for immediate sales, Last-Touch will tell you what’s pushing people over the finish line.
Here’s a quick breakdown to help you decide:
| Model | Best For... | Pro | Con |
|---|---|---|---|
| First-Touch | Understanding what drives initial brand discovery and lead generation. | Highlights effective top-of-funnel channels. | Ignores everything that happens after the first visit. |
| Last-Touch | Identifying which channels are most effective at closing sales. | Easiest to measure and understand. | Undervalues channels that build awareness early on. |
If I can leave you with one critical piece of advice, it’s this: pick one model and stick with it.
Flipping between models will turn your data into a mess, making it impossible to see if you're actually making progress. Consistency is what allows you to learn what truly moves the needle. A simple, steady model is what delivers the insights you need to confidently measure your ROI.
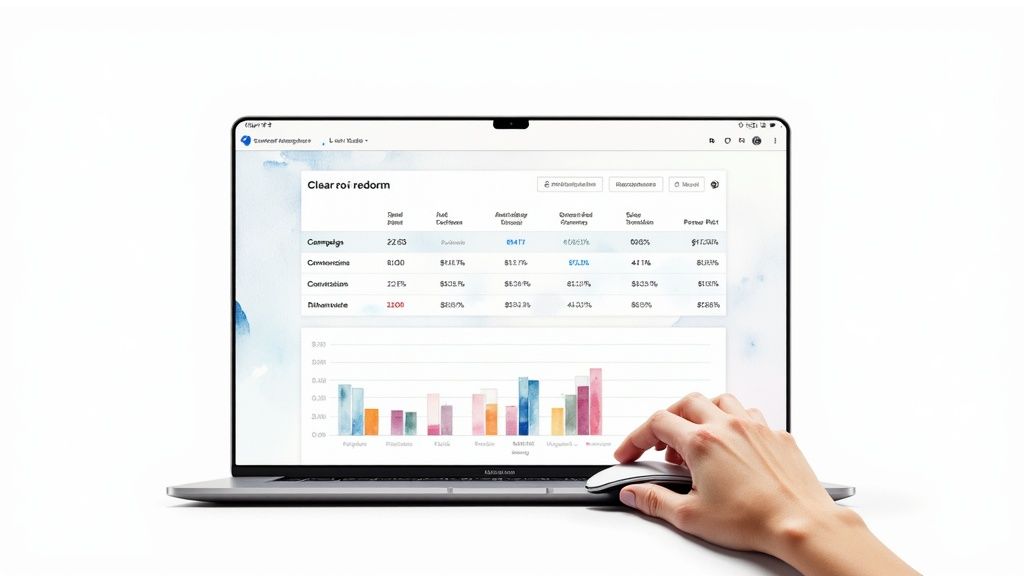
This is where all the groundwork pays off. You’ve defined your metrics, wired up your tracking, and picked an attribution model. Now, you’re ready to turn that raw data into your single source of truth: a live ROI dashboard.
The point isn't to build some overly complex, data-science masterpiece. It’s to create a practical, clear dashboard you can check in five minutes to make smarter decisions. We’re getting rid of messy spreadsheets and the chaos of jumping between a dozen different analytics accounts.
This dashboard centralizes your most important numbers, giving you a real-time pulse on your marketing performance. You can build it easily in something like Google Sheets or a flexible workspace like Notion.
Laying Out Your Dashboard
Simplicity is your best friend. A cluttered dashboard is an unused dashboard. We're going to focus on a few essential columns that tell the complete story of your marketing efforts—from the initial ad spend all the way to the final return.
Here are the core components you absolutely need:
- Campaign Name: The specific thing you're tracking (e.g., "Q4 Holiday Promo").
- Channel: The platform where the campaign is running (e.g., "Google Ads," "Facebook," "Email").
- Marketing Spend: The total cost for this specific campaign on this channel.
- Conversions: The number of desired actions, like purchases or form submissions.
- Revenue: The total income generated from those conversions.
These five inputs are your foundation. From them, we can calculate the metrics that actually matter.
Calculating the Metrics That Matter
With that foundational data in place, you’ll add columns with simple formulas to automatically calculate your most critical ROI metrics. This is what makes the dashboard come alive, turning raw numbers into something you can act on.
The two most important calculated columns are:
- Customer Acquisition Cost (CAC): This tells you exactly how much you're spending to land each new customer. The formula is dead simple:
Marketing Spend / Conversions. - Return on Investment (ROI): This is the final verdict on whether your campaign was profitable. The formula is just as easy:
(Revenue - Marketing Spend) / Marketing Spend.
This setup gives you a clean, campaign-by-campaign breakdown of what’s working and what’s not.
A live dashboard isn't just a reporting tool; it's a decision-making engine. It replaces gut feelings with hard data, empowering you to double down on high-performing channels and cut wasteful spending with confidence.
Here's a look at how you might structure this in a simple spreadsheet.
Sample ROI Dashboard Structure
| Metric | Description | Example Data / Formula |
|---|---|---|
| Campaign Name | Your internal name for the initiative. | Q1 2024 Product Launch |
| Channel | The platform where the spend occurred. | Facebook Ads |
| Marketing Spend | Total ad cost for the period. | $5,000 |
| Conversions | Number of sales or sign-ups. | 100 |
| Revenue | Total income from those conversions. | $15,000 |
| CAC (Formula) | Cost to acquire one customer. | =C2/D2 → $50 |
| ROI (Formula) | Return on your marketing spend. | =(E2-C2)/C2 → 200% |
This clean, formula-driven approach means you only have to update the first five columns, and the dashboard does the rest of the work for you.
Feeding the Beast: Where to Get Your Data
So, where does all this data come from? The key is to pull it from the sources you've already set up. You’ll be grabbing numbers from your ad platforms (like Google Ads or Snapchat For Business), your analytics tool (like Google Analytics 4), and your payment processor (like Stripe or Shopify).
Pulling post-level data from social media can be a huge time sink. Using a dedicated tool like SocialBee can help you manage and pull performance metrics from all your channels into one place, making it much easier to populate your dashboard.
A global survey found that 28% of marketers consider Facebook to have the highest ROI, with Instagram close behind at 22%. But without a unified dashboard, proving that for your own business is nearly impossible. Leaders are increasingly demanding that marketing activities tie directly to revenue, and this kind of dashboard is the most effective way to do it. You can dig into more of these social media marketing ROI statistics to see how your channels stack up against industry benchmarks.
Automation: Your Secret Weapon
Let’s be honest: manually updating a spreadsheet every single day is a recipe for failure. The real power of a live dashboard comes from automation.
While full automation can get complex, you can start with simple steps to make the process sustainable. Many platforms offer native integrations or add-ons for Google Sheets that pull data automatically. For example, the Google Analytics add-on can sync your traffic and conversion data on a set schedule.
By exploring marketing automation for small businesses, you can discover more ways to connect your tools and kill off manual data entry for good.
Even a partially automated system saves you hours and ensures your data is consistently up-to-date. That way, you can spend your time analyzing the numbers, not just copying and pasting them.
Common Questions About Measuring ROI
Even with a solid framework, some questions always pop up when you get into the weeds of measuring marketing ROI. Let's tackle the most common ones I hear. Getting these right will help you build confidence in your new process and start turning data into real decisions.
How Often Should I Calculate My Marketing ROI?
The right cadence really depends on the channel you're looking at.
For fast-moving campaigns like paid ads, you absolutely need a weekly check-in. This lets you react quickly, shifting budget away from ads that aren't working and doubling down on the ones that are. Waiting a month is just leaving money on the table.
But for slower-burn strategies like content marketing or SEO, a monthly review makes way more sense. These efforts take time to gain traction, and checking them weekly will just drive you crazy with noisy, inconclusive data.
The most important thing is just being consistent. Set a recurring task for yourself in a tool like Todoist so you actually stick to your schedule. That discipline is what helps you spot the meaningful trends over time.
What Is a Good Marketing ROI?
Everyone wants a magic number, and if you press me, a 5:1 ratio (that’s five dollars back for every one dollar spent) is a widely accepted benchmark for a “good” ROI. Hitting 10:1 is exceptional.
But honestly, the best benchmark is your own. The real question is: is your LTV-to-CAC ratio healthy?
A brand-new business might be thrilled with a 2:1 ROI if their main goal is just grabbing market share as fast as possible. As long as your ROI keeps your CAC sustainably lower than your LTV, you’re running a profitable marketing engine. That's what matters.
How Do I Measure ROI for SEO or Brand Building?
This is the tricky one. Attributing direct revenue to long-term efforts like SEO feels like trying to nail Jell-O to a wall. But it’s not impossible.
The key is to use proxy metrics to estimate the financial impact. This isn't a perfect science, but it gives you a data-backed way to justify spending on these crucial, top-of-funnel activities.
Here’s how you can approach it:
- For SEO: Calculate the value of your organic traffic by figuring out what it would have cost to get those same visitors through paid search. Just multiply your organic traffic volume by the average Cost Per Click (CPC) for your main keywords. It’s a simple, powerful way to put a dollar value on your SEO work.
- For brand and lead gen: Assign a concrete value to each new lead. Look at your historical data. What’s your typical lead-to-customer conversion rate? What’s your average LTV? A little math gives you a tangible "Lead Value" that connects your brand-building efforts directly to potential revenue.