How to Calculate Customer Churn for B2B Agencies

To get a handle on customer churn, you need a dead-simple formula: (Customers Lost in a Period ÷ Customers at the Start of the Period) x 100.
This gives you a clear percentage of how many clients you're losing over a set timeframe, whether it's a month or a quarter. This is your first, most essential step to understanding your agency's health and plugging any leaks in your revenue.
Your First Customer Churn Calculation
Staring at your subscriber list, wondering who’s about to leave? For a growing B2B agency, even a tiny churn rate can quietly eat away at your Monthly Recurring Revenue (MRR).
This simple workflow cuts through the noise and gets you a clear monthly churn percentage in under 10 minutes. This isn’t just theory; it’s a lean process built for busy founders who need to turn data into decisions—fast.
Let's walk through an example. Imagine an agency uses an outreach tool like Apollo to land new clients. At the start of March, they had 50 active clients. By the end of the month, 4 clients had canceled their retainers.
Using the formula, that's: (4 Lost Clients / 50 Starting Clients) x 100 = 8% monthly churn.
Why This Simple Number Matters
An 8% monthly churn rate might not sound like a five-alarm fire, but it compounds faster than you'd think.
A seemingly harmless 5% monthly churn rate balloons into a 46% annual loss—that’s nearly half your clients gone in a year if you don’t replace them. If that number creeps up to 10% monthly, you're bleeding over 70% of your customer base annually. For B2B professional services, the median churn is around 27% yearly, which shows just how critical this metric is. You can see more on these benchmarks in the State of Retention 2025 report.
Think of this first calculation as your business's early warning system. It doesn't tell you why customers are leaving, but it signals exactly when you need to start asking that crucial question—before it craters your revenue.
This single percentage is your starting point. It helps you quantify customer retention and gives you a solid baseline to measure all your future efforts against.
For an even deeper dive into the mechanics and various formulas, you can explore this detailed guide on how to calculate customer churn rate.
To make this even easier, here's a quick summary of the workflow you can follow right now.
Core Churn Calculation Workflow
This table breaks down the essential steps to get your first basic churn calculation done without getting lost in the weeds.
| Step | Action | Tool/Method |
|---|---|---|
| 1. Define Period | Pick a timeframe (e.g., last month). | Calendar |
| 2. Count Starters | Tally active clients on Day 1. | CRM or Spreadsheet |
| 3. Count Churners | Tally clients who canceled in that period. | CRM or Billing System |
| 4. Calculate | Plug numbers into the formula. | Calculator or Spreadsheet |
That's it. This simple process gives you a hard number you can track, discuss with your team, and work to improve. Don't overcomplicate it at the start; just get the number and build from there.
Choosing Churn Metrics That Actually Matter
Once you have a basic churn percentage, the real work begins. It's tempting to take that number and run with it, but you have to ask a crucial question: is this the right number to track?
Not all churn is created equal. Calculating the wrong metric can mask serious problems under the surface or, just as bad, send you chasing ghosts. For a growing B2B agency, it all comes down to two core concepts: Logo Churn and Revenue Churn.
Knowing the difference is critical because they tell completely different stories about your agency’s health.
Logo Churn vs. Revenue Churn
Logo Churn is the simplest metric of the two. It’s the percentage of customers (or "logos") you lose in a given period. This is the formula we used in the first section, and it’s a great starting point. It tells you exactly how many client relationships ended. Simple.
Revenue Churn, on the other hand, tracks the percentage of monthly recurring revenue (MRR) you lost from those same departing clients. This metric shifts the focus from customer count to the actual financial impact of churn.
Here's a classic agency scenario that shows why this matters. Imagine you have ten clients, and two of them leave in one month. Your Logo Churn is 20% (2 ÷ 10). Not great, but maybe not a five-alarm fire.
But what if one of those clients was a small startup paying you $500/month and the other was an enterprise account on a $5,000/month retainer? Suddenly, the story is completely different. Losing just two logos wiped a massive chunk of revenue off your books. That's the story Revenue Churn tells.
This decision tree helps visualize how different data points can signal different churn risks hiding in your CRM.
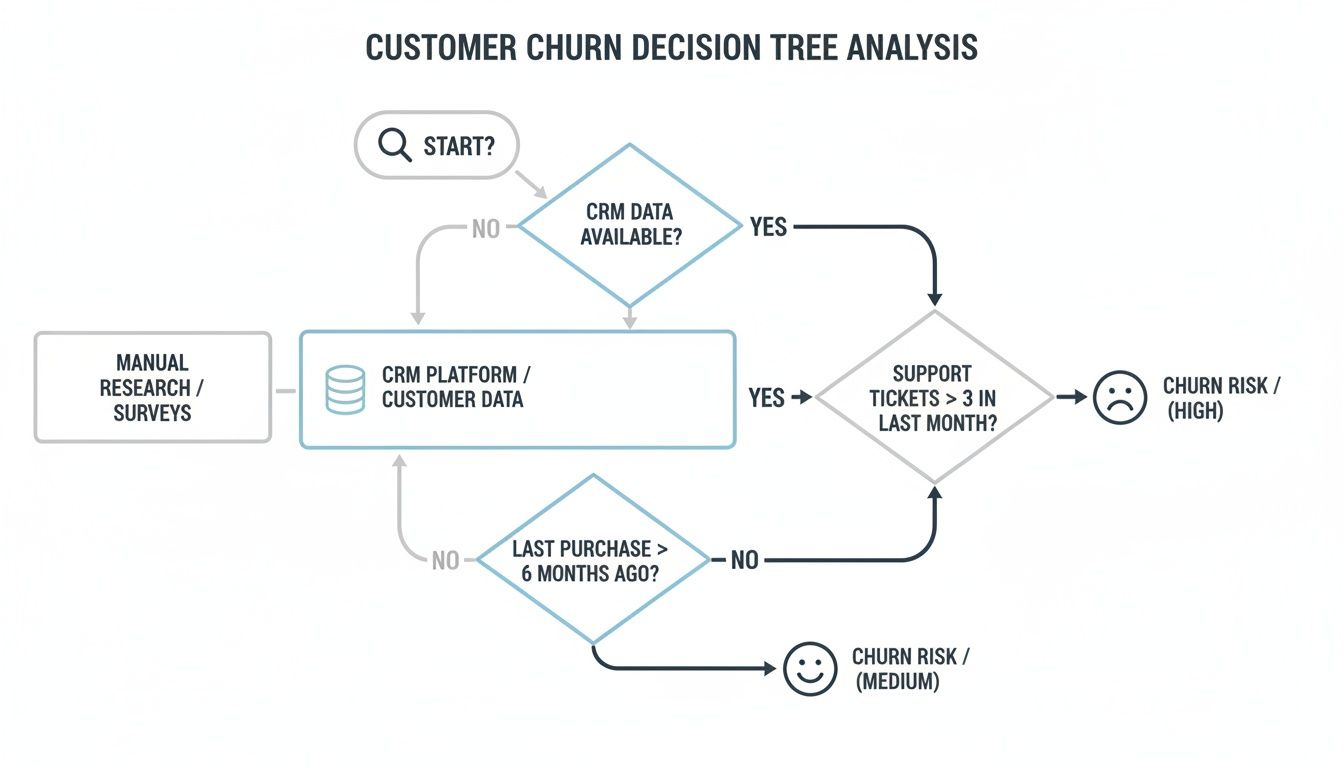
By looking at things like last contact or usage frequency, you can start predicting whether a customer is at high or medium risk of churning, long before they actually leave.
Gross vs. Net Revenue Churn
To get an even sharper picture of your financial health, you can split Revenue Churn into two more specific types.
- Gross Revenue Churn: This is the total MRR you lost from both cancellations and downgrades in a period. It’s a pure, unfiltered measure of revenue walking out the door.
- Net Revenue Churn: This is where things get really interesting. This metric takes your Gross Revenue Churn and subtracts any new revenue you gained from existing customers through upgrades, add-ons, or expansions.
For a growing agency, Net Revenue Churn is the ultimate health metric. If your existing clients are upgrading their plans faster than others are leaving, you can achieve negative net churn. This means you’re growing revenue even without signing a single new client. It's the holy grail of sustainable growth.
Tracking these metrics is essential for dialing in your entire growth strategy. To get a better sense of how churn fits into the bigger picture, you can learn more about the different B2B sales funnel stages and see where retention has the biggest impact.
For any small B2B agency, starting with Logo Churn is perfectly fine. But graduating to Net Revenue Churn is what truly reveals if your business model is built to last.
Building Your Churn Calculator in a Spreadsheet
Theory is great, but let's get practical. It's time to move from concepts to a real tool you can build yourself in Google Sheets or Excel. You don't need fancy, expensive software for this; a well-organized spreadsheet is more than powerful enough to give you a clear pulse on the health of your business.

The goal here is to create a repeatable workflow—something you can update with minimal effort each month. By the end of this section, you'll have a functional, custom churn dashboard built with tools you already use every day.
Setting Up Your Data Structure
First things first: you need to structure your customer data in a way that makes the math easy. Open up a new spreadsheet and create a sheet called "Customer Data." This will become your single source of truth.
You'll need these columns:
- Customer ID: A unique identifier for each client.
- Customer Name: The name of the client or company.
- Sign-up Date: When they officially became a customer.
- Churn Date: The date their contract ended. Just leave this blank for active customers.
- MRR: The Monthly Recurring Revenue for that specific client.
Now for the grunt work. Populate this sheet with all your current and past customers. I know, this initial data entry is the most tedious part, but once it’s done, the monthly updates become a breeze. A lot of small agencies track this stuff in project management tools like Notion, which you can usually export as a CSV to speed things up.
Pro Tip: Keep this data clean. Seriously. Inconsistent date formats or duplicate entries will wreck your formulas down the line. Use data validation on your date columns from the start to force a uniform format.
Building the Calculation Dashboard
Alright, now create a second sheet and name it "Churn Dashboard." This is where the magic happens. We’ll set up cells that automatically pull data from your "Customer Data" sheet to calculate the metrics that matter.
Your dashboard needs a couple of input cells to define the time window you're looking at. Create labels for "Start Date" and "End Date" and drop in the first and last day of the month you want to measure (e.g., 10/1/2024 and 10/31/2024).
Next up, the formulas.
- Customers at Start of Period: You’ll need a formula that counts how many customers had a
Sign-up Datebefore your "Start Date" and aChurn Datethat is either blank or falls after your "Start Date." - Customers Lost During Period: This one's easier. It just needs to count the customers whose
Churn Datefalls between your "Start Date" and "End Date."
With those two numbers, you can finally calculate your Logo Churn Rate using the simple formula we covered earlier: (Customers Lost / Customers at Start) * 100.
Handling Common Edge Cases
Real-world data is always messy. You're going to run into weird situations like customer reactivations or plan downgrades that can throw off your numbers if you don't account for them.
One of the biggest headaches is just managing multiple data sources. If you're comfortable in spreadsheets, learning how to merge in Excel can be an absolute lifesaver. It lets you combine different data exports into your master "Customer Data" sheet without resorting to a nightmare of manual copy-pasting. Trust me, that one skill is invaluable for keeping your calculator accurate and up-to-date.
Finding the 'Why' Behind Your Churn with Cohort Analysis
Calculating a single, overall churn number is a great start, but it doesn't actually tell you why your customers are leaving. It's a symptom, not a diagnosis. To find the root cause, you have to dig deeper with cohort analysis.

This approach is all about grouping customers into "cohorts" based on a shared trait, usually the month they signed up. By tracking each cohort's behavior over time, you can start asking much more powerful questions.
For example, you might find that clients you landed through automated outreach with a tool like PhantomBuster churn much faster than those who found you through organic search. Or maybe you'll spot a pattern where every cohort has a massive drop-off after three months. That kind of insight is gold.
Pinpointing Critical Moments in the Journey
Cohort analysis turns a vague problem ("our churn is high") into a specific, actionable one ("customers who signed up in Q2 are churning after 90 days"). This lets you zero in on what happened during that specific window.
- Was there a broken onboarding process? Maybe that new welcome sequence you launched wasn't as effective as you thought.
- Did a new competitor launch a killer offer? External market shifts can hit specific cohorts hard.
- Is there a gap in your service delivery? Perhaps clients just aren't seeing the value you promised by their third month.
This method helps you identify those critical moments. US businesses lose $136.8 billion every year to avoidable churn, often because of bad onboarding (23%) or weak client relationships (16%). Spotting these patterns in your cohorts is the first step to fixing these leaks before they get worse.
Matching Churn Drivers to the Right Metrics
To make your cohort analysis even more effective, you need to connect the dots between potential problems and the churn metrics that reveal them. This table shows you which metric to watch based on what you suspect is going wrong.
Common Churn Drivers and Corresponding Metrics
| Potential Problem Area | Key Metric to Track | Example Insight |
|---|---|---|
| Onboarding Fails | Logo Churn (in Months 1-3) | A high number of clients leaving early points to a confusing or low-value setup experience. |
| Product-Market Fit Issues | Gross Revenue Churn | If clients stay but consistently downgrade plans, your service might be too expensive or feature-heavy for their needs. |
| Poor Relationship Management | Logo Churn (by Account Manager) | When one account manager has a much higher churn rate, it signals a potential training or performance issue. |
| Value Perception Gaps | Net Revenue Churn | If this number is high and negative, it means expansion revenue isn't covering losses, suggesting clients aren't seeing enough value to upgrade. |
By pairing the right metric with the right cohort, you move from just tracking numbers to diagnosing real business problems. This is how you find out why people are leaving, not just that they are.
How to Read a Cohort Chart
A standard cohort chart shows the percentage of customers from each sign-up month who are still active in the following months. A healthy chart reveals a gradual, predictable decline over time.
An unhealthy one is easy to spot. It has sharp, sudden drops—often called "cliffs"—that signal something went wrong in a specific period for a specific group.
A sudden drop-off in a cohort is a massive red flag. It tells you exactly where to focus your retention efforts, whether that means improving the landing pages you build with Leadpages or refining your client follow-up sequences.
To get the full picture, you can combine cohort analysis with customer journey analysis strategies. This gives you a powerful understanding of not just when customers leave, but also the specific interactions that pushed them toward that decision. It's the difference between calculating churn and actively preventing it.
Setting Realistic Churn Goals and Taking Action
So, you’ve calculated your churn rate. The number is staring back at you from the spreadsheet. Now what? Is it good? Bad? Ugly?
For small B2B agencies or early-stage SaaS businesses, a healthy monthly logo churn rate to aim for is somewhere between 3-5%. If you can keep your net revenue churn under 2%, you’re in a fantastic spot for sustainable growth.
But hitting a benchmark isn't the real prize. The whole point of measuring churn is to turn that number into a growth lever. It’s time to shift from what the number is to why it is what it is.
Investigating the 'Why' Behind Churn
To figure out what’s pushing customers out the door, you need to get direct feedback. Don't overcomplicate it. A simple framework is all you need to get started, without bogging down your small team.
Here's how to get going:
- Simple Exit Surveys: When a customer cancels, trigger an automatic, one-question survey: "What was the primary reason you decided to cancel?" Keeping it short and sweet is the key to getting a response.
- Analyze Support Tickets: Dig into the support requests from customers who left. Are you seeing the same themes pop up again and again? Maybe they were all hitting the same technical snag or asking for a feature you don’t offer.
- Talk to Lost Customers: This is easily the most valuable thing you can do. Personally reach out to a handful of recently churned customers and ask for 15 minutes of their time. A single, honest conversation can uncover more than a month’s worth of data analysis.
The goal here isn't to win them back on the spot. It’s to understand the root cause of why they left, so you can stop the next customer from following them out the door. This feedback loop is absolutely critical.
This process transforms churn from a passive number on a dashboard into an active diagnostic tool. The insights you pull from this will directly shape your retention strategy and help you focus your efforts on improving customer lifetime value.
Do This Next: A Prioritized Action Plan
Your investigation will uncover patterns. The last step is to turn those patterns into a focused, prioritized action plan. Don't try to boil the ocean. Zero in on the single biggest lever you can pull based on what you’ve learned.
For instance, if your exit surveys are screaming about budget issues, your next move is to test different pricing tiers or offer an annual discount. If a clunky onboarding process is the culprit, focus all your energy on building a better welcome sequence using an email tool like Brevo.
By connecting the data directly to an action, your churn calculation becomes more than just a number—it becomes your roadmap for building a stickier, more resilient business.
Got Questions About Churn? We’ve Got Answers.
Even with the right formulas in hand, calculating churn for the first time always brings up a few tricky questions. It's just part of the process. Here are the most common ones we hear from other B2B agencies, with straight-to-the-point answers to get you unstuck.
What’s a Good Monthly Churn Rate for a Small B2B Business?
For a small agency or B2B company, aiming for a monthly logo churn between 3-5% is a solid target. But don't treat that as gospel. Early-stage companies often see higher churn while they're still dialing in their ideal customer profile and nailing product-market fit. That’s normal.
The most important thing is to track your own churn rate consistently and work on bringing it down. Honestly, revenue churn is usually the more telling metric. If you can keep your net revenue churn below 2%, you're in a fantastic spot for growth. That means the revenue you're adding from upgrades and expansions is outpacing what you're losing.
How Often Should I Be Calculating This Stuff?
For most lean teams, calculating churn monthly is the sweet spot. It’s frequent enough to catch worrying trends before they do real damage, but not so often that it becomes a massive administrative headache.
You might want to track weekly if you've just rolled out a major change—like new pricing or a big feature—and need to see its immediate impact. For the long haul, though, monthly reporting gives you a much more stable, strategic view of your business's health. Always compare the current month to previous ones to spot any seasonal patterns that might be at play.
Don't get lost in daily tracking. A monthly calculation gives you enough data to see real trends without overreacting to small, day-to-day fluctuations. It’s the sweet spot between staying informed and getting bogged down in noise.
My Churn Rate Seems High. What’s the First Thing I Should Do?
First, don't panic. The single most critical first step is to segment your churn. That one big, scary number doesn't tell you the whole story. You need to break it down to find out what's really going on.
- By acquisition channel: Did the clients you found using a tool like Apollo stick around longer than the ones from paid ads?
- By plan type: Are people on your cheapest plan leaving at a much higher rate? This is incredibly common.
- By client size: Are you losing more small businesses than enterprise clients, or vice versa?
Digging into the data this way will almost always show you that one specific group is driving most of the churn. Once you've found that high-churn segment, do something old-school: call a few of them. A single 15-minute conversation with a former customer will give you more actionable insight than staring at a spreadsheet for a week.
How Do I Handle Annual Subscriptions in a Monthly Churn Calculation?
This is a classic point of confusion, but the fix is simple. The best practice is to amortize the annual contract's value over its 12-month term.
Think of it this way: for your monthly MRR and revenue churn calculations, a client on a $1,200 annual plan is treated as if they're paying you $100 every month. For logo churn, they count as one active customer each month until their subscription ends.
When their renewal date comes up, if they decide not to continue, that's when you count them as one churned customer in that specific month. This method smooths out your revenue reporting and gives you a much more accurate, stable picture of your company's health.